
Based on the below headline from today’s (5/8/13) WSJ below, I decided to run a comparison on SP500 vs Hedge Fund Indices for 2 time periods. Period1 – Jan 2003 to Sep 2007. Period 2 – March 2009 to end of April 2013. As you can see from the image below, these were periods of outsized returns.

I used the S&P500 index rather than the DJIA as it gives a broader market picture. I also compared the S&P500 to two hedge fund indices – the HFRX Global and Dow Jones Credit Suisse Broad Index.
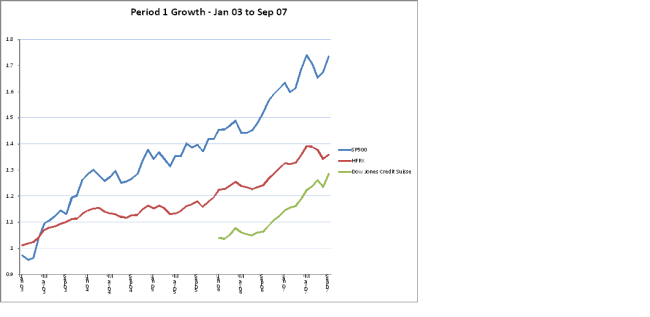
First, let’s look at period1 by viewing Growth of a $1:
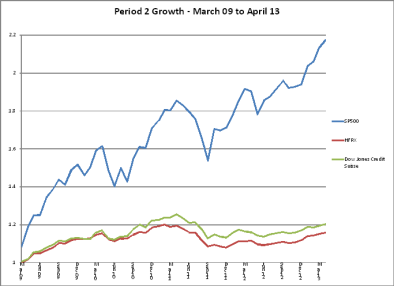
Now, Period 2
Now, let’s combine periods on the same graph:

So, what does this tell me:
1) S&P500 looking a bit overheated in comparison to the run-up of 2003 – 2007 (updated 5/14/2013). I’ve seen the “this time is different” chatter, but even “different” markets follow “laws of gravity”.
2) In relation to Hedge Funds, 2003 to 2007 looks like a long leverage bet on equities. Data confirms this. A Period1 times series analysis of S&P500 vs HRFX Global Hedge Fund Index transformed for stationarity shows a correlation of .74. The same time series analysis transformed for stationarity on Period2 index data has only a .01 correlation.
3) In terms of an uncorrelated return to equities, at a macro-level, hedge funds have delivered.
This is just a quick “back of the spreadsheet” analysis. It would be interesting to include bond and commodity indices in the mix here.
NEXT POST – A COMPARISON TO 1995, WHY TODAY’S RALLY HAS LEGS.
