Measuring the Risk in Risk Parity

Risk-Parity investment strategies focus on greater allocation to less risky investment to achieve a given return goal.  Leverage is used to “supercharge” the investment in the least risky asset class.  Conceptually, a great plan.

In practice, most risk-parity strategies use a long bond strategy.  Levering up long bonds via the use of futures and derivatives.  During the 10-year bond bull market and over the past 5-years with easy money, this has been a great tactic and led to excess returns.

The question for risk-parity investors is does this strategy hold going forward?  One school of thought says that coordinated Central Bank cheap money has inflated prices to artificial levels for both bonds and stocks.  Others say that while the bond market has peaked, the equity and commodity markets still have legs to climb higher.  No one really knows.  However, there are some factors that should lead risk parity investors to delve further into exposure analysis.  The main factor is that risk parity strategies have never been tested in a bear market for bonds.

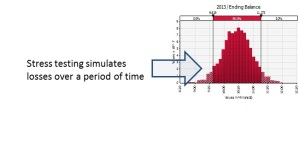
To this end, I would recommend a r-Dex analysis of any risk-parity strategy.  Never heard of r-Dex?  r-Dex or Risk Downside Exposure is similar to Value@Risk in that it measures downside risk to the expected value of a portfolio.  r-Dex measures this risk by stress-testing the “left tail” of portfolio returns.  The value of r-Dex is that it allows you to test for highly-correlated negative movements across all asset classes (dependent testing) or simulate a “break” in a single asset class (independent testing).

r-Dex

Tail testing with r-Dex


From a risk-parity standpoint,  r-Dex would allow you to simulate risk of a simultaneous break in both equity, bond, and commodity markets.  Given that almost everyone agrees that the bond market has minimal upside potential, at a minimum, a r-Dex Independent test could be run only on fixed income assets.

Either way, using r-Dex would allow you to evaluate the Risk in Risk Parity.

Excel and The Power of Fat-Fingering

The news that Reinhart and Rogoff’s study of Austerity Economics has flawed conclusions due to basic Excel errors has perked the interest of mainstream media.  One article states that up to 80% of spreadsheets have some form of error.  

My answer is…..So What?  Excel is a tool and it can be used well or poorly.  I can use my hammer correctly or hit my thumb instead of the nail.  As a financial analyst, I also make mistakes in Excel as I parse data, change columns, add data, etc…  However, I have learned through the years to cross-calculate my work as well as stress and back-test important findings.  I have also run simulations to look at best case, worst case, likely case scenarios.  Any “out-of-balance” findings are reviewed for accuracy.  Furthermore, when presenting findings, I always prefer to have a “peer review” of my calculations and methodologies.

The real issue of excel errors is not fat-fingering errors but what I will term “fat-heading” or the failure to test one’s conclusions.  Reinhart and Rogoff had a pre-disposed vision.  When the data validated their initial hypothesis, their rush to judgment (and to publish) became a higher priority than validation.  Back to the tool example here,  measure twice cut once, should have been the go-forward metaphor.  However, I am sure I have made my share of fat-headed mistakes as I rushed to deliver findings as well.

So, here is a list of ways to minimize fat-headed mistakes and keep excel humming along as a calculation engine (Listed in increasingly complexity and time commitment):

1.  Use Ctrl + ‘ keys to show formulas in all cells

2.  If you are creating a shared workbook, use the Track Changes functionality in Excel (http://office.microsoft.com/en-us/excel-help/track-changes-in-a-shared-workbook-HP010342961.aspx)

3.  Cross-calculate summary cells 

4.  Create a validation worksheet that re-calculates and compares key formulas

5.  Use a validation tool such as XLTest to validate calculations

6.  Use a Monte Carlo simulation tool to test worst case, best case scenarios

7.  For time-series investment and trading related calculations, back-test results with real-world data

8.  Peer review of spreadsheets.