Bootstrap comparison: Risk Parity vs Alternative+ Portfolio
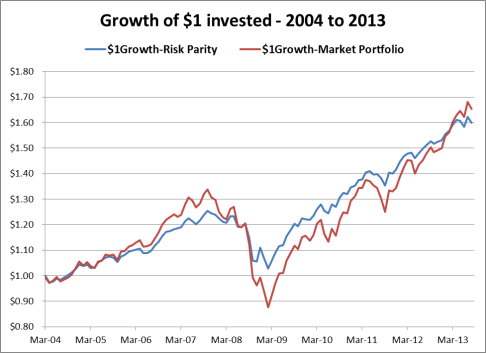
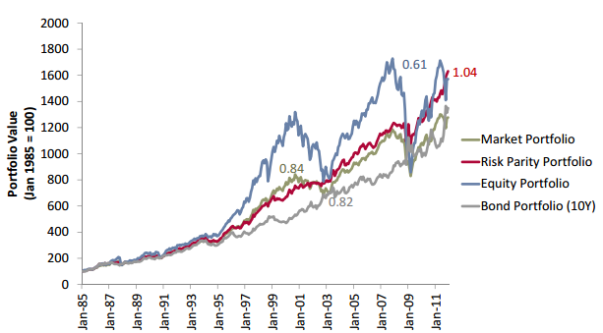
The graph below shows growth of a $1 invested since March 2004 for a passive, non-levered risk parity portfolio as compared with a 60% equity/40%bond market portfolio. As expected, the risk-parity portfolio lowers downside risk via diversification and maintains a greater return until 2Q2013. The market portfolio closes the gap and then overtakes the risk parity portfolio only due to the extended bull market from 3Q2012 to 1Q2013.
*Risk Parity portfolio consists of 8.8% Ticker: VB, 10.7% Ticker:SPY, 10.6% Ticker: IWD, 10.8% Ticker: IWF, and 59.1% Ticker: AGG. Market Portfolio is 60% Ticker: SPY and 40% Ticker: AGG
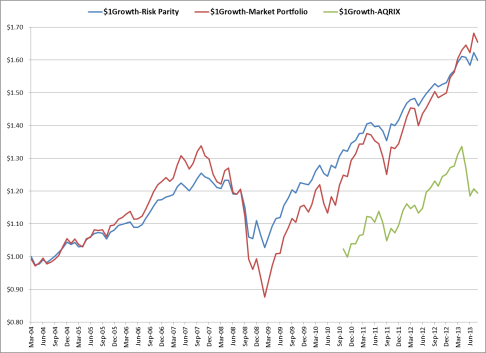
As the growth comparison is based on a passive, non-levered risk parity strategy, a chart of AQR’s Risk Parity strategy is also included as AQR uses both leverage and active management. The inception of this mutual fund is in 2010 so the chart is from October 2010 until August 20, 2013. The reversal in May 2013 markedly stands out in this graph.
Investment in alternative funds that provide absolute and low correlation to equity returns should also provide downside protection and a risk/return structure similar to risk parity strategies. Alternative funds and ETFs have become increasingly popular as a method to provide hedge fund like returns without the 2/20 administrative costs of hedge funds. Many of these funds started trading post-crisis and therefore don’t have a long track record. However, indices such as Hedge Fund Research’s Global Hedge Fund Index (HFRX) may provide a proxy measure for aggregate level performance.
For purposes of this research, two alternative funds were chosen. The first is the Natixis ASG Global Alternatives Fund (Ticker: GAFYX). The second is Goldman Sachs Absolute Return Tracker Fund (Ticker: GARTX). GAFYX is an absolute return fund that seeks to provide capital appreciation consistent with a portfolio of hedge funds. Similarly, GARTX also seeks to provide returns consistent with investment in a basket of hedge funds. Both GAFYX and GARTX began trading in 2008.
Two alternative portfolios were created. Alternative portfolio1 has a 40% allocation to Fixed Income (AGG), 40% allocation to equities (SPY), and 20% to the alternatives fund (GARTX). Alternative portfolio2 has a 40% allocation to Fixed Income (AGG), 40% allocation to equities (SPY), and 20% to the alternatives fund (GAFYX). A 20% allocation to alternatives came through reduction of the 60% equity allocation in the market portfolio. The basis of only decreasing the equity allocation is that, historically, returns from a basket of hedge funds have a higher correlation with equities than bonds . Likewise, a basket of hedge funds also should provide downside protection when applied to equity investments.
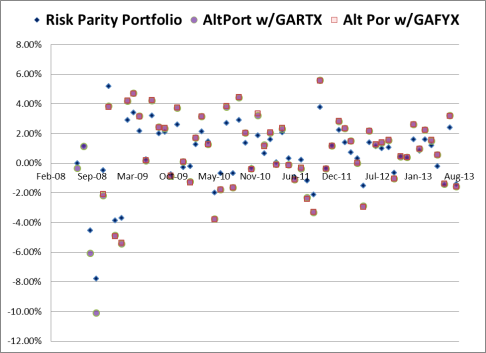
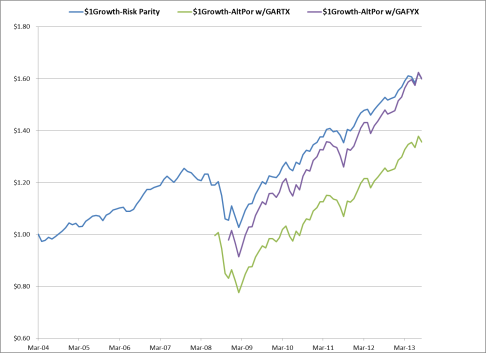
Since both GAFYX and GARTX began trading in 2008, comparisons to risk parity portfolios are only from 2008 until August 2013. The first comparison is a Scatter Plot of returns. Correlations of the risk parity to the alternative portfolio returns are extremely high and correlation of the risk parity portfolio to the alternative component GARTX and GAFYX are 0.6 and 0.88.
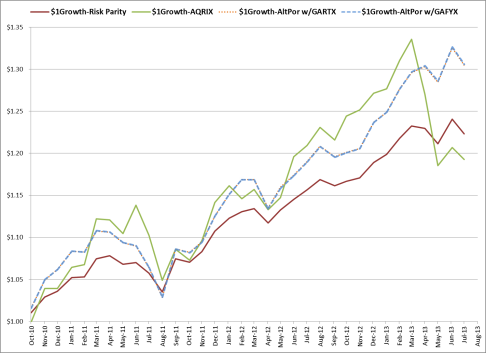
Interestingly, correlation of the AQR fund (AQRIX) to GARTX and GAFYX are much lower (0.22, 0.38) which points to the effect of active management of a risk parity strategy. The $1Growth charts shows how closely a passive risk parity and alternative portfolio have moved together since 2010.
These graphs again show the large relative valuation drop in an active risk parity strategy (AQRIX) starting in May 2013 as compared to the relative stability to an alternative+ portfolio.
Does this prove that alternative+ portfolios are the new risk parity strategies?
No. However, this does infer that alternative portfolios can provide passive risk parity like returns. In theory, they should also provide downside protection as well. That said, more statistical comparisons and analysis should help to determine if alternative+ portfolios will have the effectiveness and popularity of risk-parity strategies.

